The most popular coding language for the web is javascript; so much so that since the advent of HTML5, it has now been officially accepted as the default standard. Javascript has moved beyond a smaller client-side browser-based language to become integrated not just for front-end design, but also for back-end server-side development. As a result there are has been a huge growth of Javascript libraries, ranging from the popular JQuery library all the way through React.js, Angular, and VUE.js.
While can seem a little overwhelming deciding which library or framework to use for developing your pages, once you get an understanding of the strengths and weaknesses of the different languages, the decision becomes a good deal less complicated . There’s no reason to stick with a single library, and different frameworks have different purposes. This is absolutely as true with Raphael.js as it is with any of the others.
However, before we discuss this, let’s take a step back. The main area where Javascript continues to reign is in front-end development, which continues to be one of the biggest growth areas on the web. This is the case for some fairly obvious reasons; it is the part of the web that people see. One of the biggest appeals of developing for the front end, is that it is an excellent place for artists to show their work.
Historically, artists will work with any medium that can be manipulated for creative purposes., but each generation finds new ones that become popular. As cave walls were a popular artistic medium in the earliest stages in human development, modes of expression soon moved toward creating sculptures in stone.
As new materials appeared, they too became used for artistic expression. Throughout much of civilized history, canvas and oil paints made it possible for fantastic paintings to be created. In fact the word “canvas” has now become synonymous with any artistic medium.
Today, one of the most popular artistic media is the web, and the web browser has become a new canvas. Artists flock to the web, not only because of its flexibility, but also because it can serve simultaneously as a gallery for works, be they individual masterpieces, or functional and usable artisinal pieces. Anyone can start a blog, and if it can be created, it can be viewed by anyone, by typing in a simple URL or clicking a link.
The web becomes the gallery, and the browser becomes our canvas, but we need our tools, our paint, and our brushes. This is where Raphael appears.
What is Raphael?
Named for the artist Raffaello Sanzio da Urbino, Rapahel.js is a javascript library designed specifically for artists and graphic designers. It is the brush that you can use to apply images directly to the canvas of the browser.
With Raphael.js you are given the power of Scalable Vector Graphics (SVG) to be able to use your web browser to created detailed drawings, which, when combined with the pigments available in your CSS paint kit, you can create beautiful and professional graphics right on the screen, without having to rely on using uploaded images. As Javascript has already become the official language of the web, it should work seamlessly with almost any browser, and load quickly into any web page.
Scalable Vector Graphics
Let’s take a look at Scalable Vector Graphics, or SVG. As a graphic artist, you may already be familiar with SVG. If you’re not, let’s break this down a little. Vector graphics are a method for creating digital images using mathematical commands in a two or three-dimensional space. If you remember your high-school math, you’ll remember the XY axis. That is your two dimensional space, with X representing a horizontal coordinate, and Y, the vertical. (For three dimensions, you add Z for depth, but that’s beyond where we’re going here). Scalable Vector Graphics are simply a method of describing drawings in this system using an XML format. Here’s an example for drawing a circle:
<svg width="80" height="80">
<circle cx="40" cy="40" r="30" stroke="#000" stroke-width="1" fill="#FFF" />
</svg>

You’ll note that we are defining the size of the circle and then the XY axis at half of the size, and then the “r” simply specifies the radius. Pretty straightforward, right?
Raphael Demonstration
Using SVG drawing images into an HTML page will work, however it can be fairly clumsy for actual graphic design. It is necessary to define each and every element, and your code can end up a little cluttered. You can do much of what you want, but you will need to define each and every element, and it requires a little more complex visualization to be able to create more elaborate designs. Styling the image means jumping back and forth into your CSS files, or putting awkward inline styles directly into your code. Actually creating art or useful designs beyond those simply shapes can require a monumental amount of effort (not to mention how unsightly your code can start to look!)
Let’s take a quick look at what Raphael can do. With only a few lines of code, you can draw far more elaborate shapes, using vectors as if you are handling a brush or pencil. Here’s the same image, using Raphael.
<div id="container"></div>
<script src="http://cdnjs.cloudflare.com/ajax/libs/raphael/2.1.0/raphael-min.js"> </script>
<script>
var paper = Raphael("container", 500, 300);
var dot = paper.circle(250, 150, 30).attr({
fill: "#FFF",
stroke: "#000",
"stroke-width": 1
});
</script>
If you run this in your browser, you’ll see that it works very similarly. However in the code, you can see a few difference. First you’ll note that we have defined a container div, and within the Raphael object, we have set some clearly defined dimensions on the XY axis. This your canvas. Like a painter, you have set up your work space. You have a clean, blank surface with which to work. Everything you work on, will now live within your canvas (in this case, named named as the variable “paper”). You can see that not only did we define the circle, but we also defined the XY location on the paper itself. However, as Raphael is a javascript library, we have the ability to be a lot more flexible and can create shapes that could be painstaking if done manually using SVG in the XML format. By bringing in some of your basic mathematical skills, you can create shapes that would have taken a long time to create, using other methods. Here’s an example of one of the creative things that you can do:
window.onload = function() {
var paper = new Raphael("container", 500, 300);
for(var i = 0; i < 5; i+=1) {
var multiplier = i*5;
paper.circle(250 + (2*multiplier), 150 + multiplier, 50 - multiplier)
With a few few quick calculations using the power of Javascript, you can generate an image that looks like this:
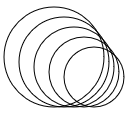
You can begin to see the possibilities. Raphael let’s you enter create complex images mathematically right in the page, without having to jump back and forth into the CSS file. Let’s take a look at what we can do if we just add a little bit of styling right into our original image:
var dot = paper.circle(250, 150, 30).attr({
gradient: '90-#000-#FF0000',
stroke: '#000',
'stroke-width': 3,
'stroke-linejoin': 'round',
rotation: -120
});
Your simple circle is suddenly no longer just a plain image on the page. You should get a result that looks like this:

The results you get start to take a genuine artistic flair, and suddenly your SVG images start to come alive. If you are already familiar with the power of using SVG, you already know that there’s a lot more that you can do than making pretty colored circles. You can draw pretty much any shape that comes to mind, ranging from other basic geometric shapes, to straight lines, to curving arcs and patterns.
Why use Raphael?
After going over some of the demonstrations above, I can already sense the excitement you are feeling as you become familiar with what Raphael can do. While there are a few other libraries that can do similar things as Raphael, such as D3, Raphael is distinct for a few reasons.
D3 is certainly a very powerful tool and will do much of what Raphael does. Most of what you can do in Raphael you can also do in D3. Many will argue that D3 is far more powerful, and indeed it can handle more complex graphics, particularly for business purposes. However, from an artistic standpoint, you already know that you don’t always want to use the same tool for everything. Sure D3 is powerful. So is a heavy duty spray gun. That does not mean that it is right for all artistic purposes. Sometimes you only need a simple brush.
Raphael also has a few advantages that D3 does not. Raphael has a much lower learning curve. From an artistic point-of view, you may not wish to spend months getting used to your tools, when all you really want do is to start painting. Another huge advantage of Raphael is that it will work in older browsers. Older versions of IE do not allow SVG to be rendered directly. Raphael will even work in IE6, something which very few modern tools can claim. From the very important standpoint of usability and user experience, as a rule, you generally do not want to force users to change their tools simply to see your beautiful creations. Raphael is also popular, meaning that not only is it likely to be around for a long time, it also means that there is a ton of support available for free! Who can argue with that?
There really is no reason not to learn Raphael, especially considering the ease of entry, so why not jump right in and start creating?